Harry Tuinier.nl

Geen categorie

image_pdfimage_print

Tip of the Month – November 2025

Most interesting lists at the front of the Attention Board.

On the left side of the Attention Board, there’s a block containing the lists Delaval thinks are the most important of all available lists.
But you and I often have different opinions about that!
From the entire arsenal of lists offered by DelPro or created by you or your advisor, you can choose which ones you actually want to see there.
How can we customize these to our own preferences?
When you click the yellow Lists tab, you’ll find all available lists.
By right-clicking the list you want, you’ll get many options, including “Add to Attention board.” We’ll confirm this. You’ll then be asked which chapter you want to add it to, or you can create a new chapter.
An icon will then appear next to that list.
For lists that also have such an icon but that you never view, you can remove that icon in the same way.
Then we return to the Attention Board. Let’s refresh it first!
Above the block with preferred lists, you’ll see a faint “V” sign. Click on it.

This will display all lists with an Attention Sign icon.
The list you added will now be listed, but it still needs to be checked.
Only the checked lists will be shown when you click the “V” above the block again.


An example of what it might look like (in Dutch):

Daily checklists
Weekly checklists
Monthly checklists
Fertility checklists


Tip of the Month – July 2025

Grouping and Ungrouping.

With some lists it is very useful when you do not see the performance of the individual cows for an overview, but for example only the cows of lactation 1 and subsequent lactations or of certain lactation stages depending on each other. So that you can see how that couple of animals is doing on your farm.

It is very interesting to view the performance of both the animals you want as a group but also the individual cows or the entire herd in the same list.
And if you have indicated in DelPro which breed the cows have or which father then you can also easily Group on that.
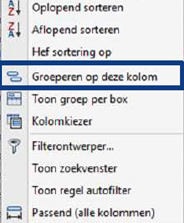
You can easily do this by clicking on the right mouse button in the gray area where your choice, for example lactation number, lactation stages, …., is located and clicking on “Group by this column”. (View place and symbol in Dutch)
It becomes even more fun when you click on “Average” or “Sum” below interesting colums, again with the right mouse button. Then you can see how the results are per group.
Or how often a diagnosis occurs or how much of a medicine has been used.
And when you want to put it back to animal level, in the same place where “Group by this column”  was, it now says “Ungroup”

This is very useful for feed lists and production lists, but also for Diagnoses and Treatments.
And once you know this option, you will definitely use it more! Have fun!

Tip of the Month – June 2025

Do you (ever) have an increased Germ count / Plate count ?

Then of course immediately contact your VMS technician / cooling tank technician.

But what can you do yourself in the meantime:

1. Check whether sufficient cleaning agent is used.
2. Is the (end) temperature of the cleaning high enough?
3. Is the milk filter replaced often enough?
4. Do you clean the rod around which the filter is placed properly?
5. Is the thread of the filter seal clean?
6. What is the water hardness (limescale), is it cleaned often enough with acid?
7. Do you always clean after each cow separation?
So even if it is not penicillin milk and / or a heifer with colostrum!
Does not always have to be a main cleaning.
8. If the robot is not too heavily occupied and no VMS visits for 30-45 minutes? => Cleaning!
Does not always have to be a main cleaning.
Summer day this is even more important!
9.  When the cows are in the pasture and there is no milking for a while? => Main cleaning!
10. Are the teat liners replaced regularly and are the milk hoses still good?
11. Is the pre-treatment cup and valve clean and working fine?
12. Is the robot room and everything that touches cups “workable clean”?

Tip of the Month – November 2024

Fluctuations in daily production, incomplete milkings, kicking off, etc.

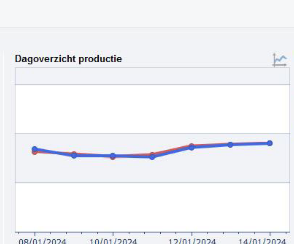
When you look at the Attention board at Daily production overview, there is a symbol of a graph at the top right. If you click on it, a graph will appear where you can see over a longer period what the average daily production has been in the period you specified.

It is interesting to look at this over a period of a year or even longer.

The average number of milkings per day can be seen and also whether more or fewer incomplete milkings or kicking offs occurred in a certain period or on certain days.

Sometimes you see slow changes, sometimes peaks or troughs.

Can you remember why things went less well or better than average in certain periods / days? For example, a major ration change, hoof-trimming day, many new heifers calved, a long standstill due to a malfunction or service, ….. .

And, even better, can some negative changes be prevented in the future?

Tip of the Month – September 2024

Do you have a concentrate feed box?

Sometimes you need a concentrate feed box to be able to give the desired extra amount of concentrate feed that cannot be taken up in the milking robot to high-producing cows.

Do you have insight into whether these cows are actually coming there and whether the programmed amounts are being taken up sufficiently?
There are nice lists to show this, especially when it is programmed as an extra type of feed.

And when was the concentrate feed box last calibrated?